How to Measure Marketing Performance: KPIs, Metrics & Analytics
How to Measure Marketing Performance: KPIs, Metrics & Analytics
Marketing does not end when a campaign goes live.
Launching a campaign is only the beginning. To understand whether your marketing is actually working, you need to measure what happens after people see an ad, click a link, visit your website, submit a form, make a purchase or interact with your brand.
This is where marketing measurement becomes important.
Marketing performance measurement is the process of collecting, analyzing and interpreting data to understand whether your marketing activities are achieving their intended goals.
A good measurement framework helps answer questions such as:
• How much traffic are our campaigns generating?
• Are people engaging with our ads and content?
• How many visitors are becoming leads or customers?
• How much does it cost to acquire a customer?
• Which campaigns are generating the best results?
• Which channels deserve more or less budget?
• Are we generating revenue or simply generating activity?
• Which parts of the customer journey are contributing to conversions?
The goal is not to track every number available.
The goal is to identify the numbers that help you make better decisions.
---
## 1. What Is Marketing Performance Measurement?
Marketing performance measurement is the process of evaluating marketing activities using data and predefined objectives.
It combines campaign data, website analytics, conversion data, customer information and business outcomes to determine whether marketing efforts are producing meaningful results.
For example, imagine a company spends ₹100,000 on digital advertising.
The campaign generates:
• 500,000 impressions
• 10,000 clicks
• 2,000 website visitors
• 300 leads
• 40 customers
• ₹400,000 in revenue
Looking only at impressions would tell you that the campaign received significant exposure.
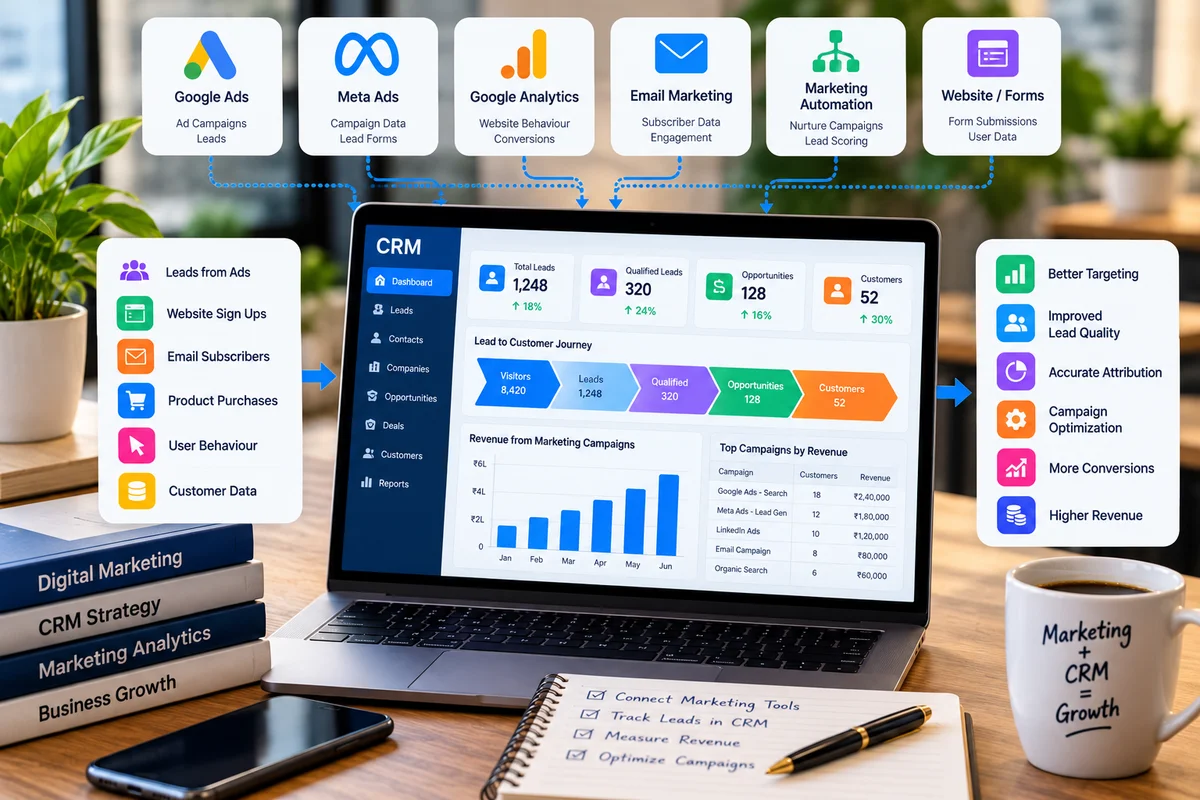
Looking at clicks would tell you that people interacted with the advertising.
But the business is ultimately interested in what happened further down the funnel.
Did those clicks generate leads?
Did those leads become customers?
Did the customers generate enough revenue to justify the advertising cost?
That is why marketing measurement needs to go beyond surface-level metrics.
---
## 2. Start With the Business Objective
Before selecting KPIs, define what the marketing activity is supposed to achieve.
Different businesses can have completely different marketing objectives.
Common objectives include:
• Brand awareness
• Website traffic
• Lead generation
• Sales
• App installs
• Product purchases
• Customer acquisition
• Customer retention
• Revenue growth
• Repeat purchases
For example:
An awareness campaign may focus on reach, impressions and video completion.
A lead-generation campaign may focus on leads, conversion rate and cost per lead.
An e-commerce campaign may focus on purchases, revenue, ROAS and customer acquisition cost.
A B2B company may care more about qualified leads, opportunities, pipeline value and closed revenue.
The KPI should therefore follow the business objective.
Do not choose a metric simply because it is easy to report.
---
## 3. What Is a KPI?
KPI stands for Key Performance Indicator.
A KPI is a metric that is particularly important for evaluating progress toward a specific business or marketing objective.
Not every metric is a KPI.
For example, a campaign may have:
• Impressions
• Clicks
• CTR
• Sessions
• Leads
• Conversion rate
• CPA
• Revenue
• ROAS
All of these are metrics.
However, if the primary objective is generating profitable sales, revenue, CPA and ROAS may be more important KPIs than impressions.
A useful KPI should help answer:
"Are we moving toward our goal?"
---
## 4. KPI vs Metric
The terms KPI and metric are often used interchangeably, but they are not exactly the same.
A metric is a measurable data point.
A KPI is a metric that has been selected because it is important to evaluating performance against an objective.
For example:
Goal:
Generate qualified leads.
Possible metrics:
• Impressions
• Clicks
• CTR
• Website sessions
• Form submissions
• Leads
• Cost per lead
• Qualified leads
Possible primary KPIs:
• Qualified leads
• Cost per qualified lead
• Lead-to-opportunity rate
The distinction helps marketing teams avoid reporting dozens of numbers without understanding which ones actually matter.
---
# 5. The Marketing Funnel and Measurement
Marketing performance is easier to understand when you look at the customer journey as a funnel.
A simplified funnel may look like:
Awareness
↓
Engagement
↓
Website Visit
↓
Lead
↓
Qualified Lead
↓
Customer
↓
Revenue
↓
Retention
Different metrics become useful at different stages.
### Awareness
Common metrics:
• Reach
• Impressions
• Video views
• Video completion rate
• Frequency
### Engagement
Common metrics:
• Clicks
• CTR
• Engagement rate
• Landing-page interactions
### Conversion
Common metrics:
• Conversions
• Conversion rate
• Cost per conversion
• Cost per lead
### Revenue
Common metrics:
• Revenue
• Average order value
• ROAS
• ROI
• Customer acquisition cost
### Retention
Common metrics:
• Repeat purchase rate
• Customer lifetime value
• Retention rate
• Churn rate
This funnel approach helps marketers understand where performance is strong and where potential problems exist.
---
# 6. Impressions
An impression represents an instance where an advertisement or piece of content is displayed.
Impressions are useful for understanding exposure.
For example:
A campaign generates 500,000 impressions.
That tells you the campaign was served 500,000 times.
However, impressions do not tell you whether people clicked, converted or generated revenue.
Therefore, impressions are usually more useful as an awareness or delivery metric than as a standalone measure of business success.
---
# 7. Reach
Reach represents the number of unique people or users exposed to your content or advertising, depending on the platform's measurement methodology.
Reach and impressions are different.
For example:
Reach = 100,000
Impressions = 250,000
This could indicate that the campaign generated multiple exposures among some of the people reached.
Reach is particularly useful for awareness campaigns.
---
# 8. Frequency
Frequency helps indicate how often, on average, an audience was exposed to an advertisement.
A simplified calculation is:
Frequency = Impressions ÷ Reach
Example:
250,000 impressions ÷ 100,000 people reached = 2.5 average frequency.
Frequency can help marketers understand whether audiences are receiving enough exposure or potentially being shown the same advertising too frequently.
This is especially important in display, video and social advertising.
---
# 9. Click-Through Rate (CTR)
CTR measures the percentage of impressions that resulted in clicks.
Formula:
CTR = Clicks ÷ Impressions × 100
Example:
10,000 clicks ÷ 500,000 impressions × 100 = 2% CTR
CTR can help evaluate how effectively an ad encourages users to interact with it.
However, CTR should not be evaluated in isolation.
A campaign can have a high CTR but poor conversion performance.
For example:
Campaign A:
CTR = 5%
Conversions = 10
Campaign B:
CTR = 2%
Conversions = 100
If the objective is conversions, Campaign B may be more valuable despite its lower CTR.
---
# 10. Conversion Rate
Conversion rate measures how frequently users complete a desired action.
A simplified formula is:
Conversion Rate = Conversions ÷ Relevant Visits or Interactions × 100
For example:
1,000 landing-page visitors
50 completed forms
Conversion rate = 50 ÷ 1,000 × 100
Conversion rate = 5%
The exact denominator should match the measurement context.
For example, you may calculate conversion rate based on sessions, users, clicks or ad interactions depending on the platform and analysis.
The important point is to define the calculation consistently.
---
# 11. Cost Per Click (CPC)
CPC stands for Cost Per Click.
Formula:
CPC = Advertising Cost ÷ Clicks
Example:
₹20,000 spend
10,000 clicks
CPC = ₹2
CPC helps marketers understand the average amount paid for each click.
It can be useful when analyzing traffic acquisition efficiency.
However, a low CPC does not automatically mean good performance.
Cheap clicks are not necessarily valuable clicks.
If those clicks never produce leads, sales or other meaningful actions, the campaign may still perform poorly.
---
# 12. Cost Per Lead (CPL)
CPL measures the average advertising cost required to generate a lead.
Formula:
CPL = Advertising Cost ÷ Leads
Example:
₹50,000 advertising spend
500 leads
CPL = ₹100
CPL is particularly useful for lead-generation campaigns.
But again, volume alone is not enough.
Suppose:
Campaign A:
1,000 leads
CPL = ₹50
Campaign B:
300 leads
CPL = ₹100
If Campaign B generates much higher-quality leads that become customers, it may actually create more business value.
This is why lead quality should be measured alongside CPL.
---
# 13. Cost Per Acquisition (CPA)
CPA represents the average cost required to acquire a desired conversion or customer, depending on how the metric is defined.
Formula:
CPA = Advertising Cost ÷ Number of Acquisitions
Example:
₹100,000 spend
200 acquisitions
CPA = ₹500
CPA becomes particularly valuable when the business has a clear understanding of what constitutes an acquisition.
For one campaign, acquisition may mean a purchase.
For another, it may mean a qualified lead.
Always define the conversion being used.
---
# 14. Return on Ad Spend (ROAS)
ROAS measures the revenue or conversion value generated relative to advertising spend.
Formula:
ROAS = Revenue or Conversion Value ÷ Advertising Cost
Example:
Advertising spend = ₹100,000
Revenue = ₹500,000
ROAS = 5
This can be expressed as 5:1.
In simple terms, ₹1 of advertising spend generated ₹5 in measured revenue or conversion value.
ROAS is especially useful for campaigns where conversion values can be measured.
However, ROAS is not the same as profit.
A campaign can have a strong ROAS while still producing limited profit if product costs, salaries, shipping, discounts and other expenses are high.
---
# 15. Return on Investment (ROI)
ROI evaluates the return generated relative to the investment.
A simplified formula is:
ROI = (Return − Investment) ÷ Investment × 100
For example:
Investment = ₹100,000
Return = ₹150,000
ROI = (₹150,000 − ₹100,000) ÷ ₹100,000 × 100
ROI = 50%
ROI can provide a broader business perspective than ROAS because it can consider costs beyond advertising spend.
The exact ROI calculation should therefore be aligned with the company's financial definition.
---
# 16. Revenue and Conversion Value
Revenue is one of the most important measurements for businesses selling products or services.
But marketers should distinguish between:
• Number of conversions
• Conversion value
• Revenue
• Profit
Suppose two campaigns each generate 100 purchases.
Campaign A generates ₹200,000.
Campaign B generates ₹500,000.
Both generated the same number of purchases, but they did not generate the same value.
Assigning appropriate conversion values can help marketers evaluate the difference between conversion volume and business value.
Platforms such as Google Ads support conversion values so advertisers can measure more than simply the number of conversions. Conversion values can also support value-based optimization and ROAS measurement.
---
# 17. Customer Acquisition Cost (CAC)
Customer Acquisition Cost, or CAC, measures how much it costs a business to acquire a customer.
A simplified formula is:
CAC = Total Customer Acquisition Costs ÷ New Customers
Depending on the business, customer acquisition costs may include more than advertising.
They could include:
• Advertising
• Sales salaries
• Marketing software
• Agency fees
• Creative production
• Sales operations
• Other acquisition-related costs
For example:
If a company spends ₹500,000 on acquisition activities and gains 250 new customers:
CAC = ₹2,000
CAC becomes particularly useful when compared with customer value.
---
# 18. Customer Lifetime Value (CLV)
Customer Lifetime Value estimates the value a customer may generate over the relationship with a business.
The exact calculation can vary significantly depending on the business model.
For example, a subscription business may consider:
• Average monthly revenue
• Gross margin
• Retention period
• Churn
An e-commerce business may consider:
• Average order value
• Purchase frequency
• Customer lifespan
• Margin
CLV is useful because a customer should not always be evaluated only on the value of the first transaction.
A customer who initially generates ₹1,000 may generate ₹10,000 over several purchases.
---
# 19. Lead Quality Matters
One of the biggest mistakes in marketing measurement is focusing only on lead volume.
Imagine two campaigns:
Campaign A:
500 leads
Campaign B:
200 leads
At first glance, Campaign A appears better.
But suppose:
Campaign A produces 20 customers.
Campaign B produces 50 customers.
Campaign B generated fewer leads but more customers.
This means the marketing team should investigate lead quality, not simply lead volume.
Useful metrics include:
• Qualified leads
• Lead-to-opportunity rate
• Opportunity-to-customer rate
• Customer acquisition cost
• Revenue per lead
• Revenue per customer
This becomes particularly important for B2B marketing.
---
# 20. Attribution: Which Channel Gets Credit?
A customer may interact with several marketing channels before converting.
For example:
1. Sees a social media advertisement
2. Searches for the company on Google
3. Visits the website
4. Receives an email
5. Returns through a display advertisement
6. Completes a purchase
Which channel should receive credit?
This is an attribution question.
Attribution is the process of assigning credit to different marketing touchpoints that contribute to a conversion or other meaningful action.
Modern analytics platforms provide different attribution approaches for analyzing customer journeys.
The important lesson is that the last interaction is not necessarily the only interaction that influenced the customer.
---
# 21. Why Attribution Matters
Without attribution, marketers can easily make incorrect decisions.
For example:
A company might notice that many conversions are recorded under direct traffic.
It may conclude that advertising is not contributing significantly.
But the actual customer journey might have started with:
Paid advertising → organic search → direct visit → conversion.
The advertising interaction may have played an important role even though it was not the final touchpoint.
This is why marketers should evaluate customer journeys and attribution rather than looking at a single traffic source in isolation.
---
# 22. Use UTM Parameters for Campaign Tracking
UTM parameters help marketers identify where website traffic comes from.
Common parameters include:
• utm_source
• utm_medium
• utm_campaign
• utm_content
• utm_term
For example:
A campaign link could contain:
utm_source=linkedin
utm_medium=social
utm_campaign=career_guide
This helps analytics platforms identify campaign traffic more clearly.
A consistent naming convention is important.
For example, avoid creating multiple versions such as:
when they are intended to represent the same source.
Inconsistent naming can make reporting harder to interpret.
---
# 23. Marketing Dashboards
A marketing dashboard brings important performance data together in one place.
A dashboard might include:
### Traffic
• Users
• Sessions
• Traffic sources
• Landing pages
### Advertising
• Spend
• Impressions
• Clicks
• CTR
• CPC
• Conversions
• CPA
• ROAS
### Website
• Engagement
• Key events
• Conversion rate
• Landing-page performance
### Business
• Leads
• Qualified leads
• Customers
• Revenue
• CAC
• ROI
The dashboard should not contain every available metric.
It should contain the information required to make decisions.
---
# 24. How to Build a Simple Marketing Measurement Framework
You can build a measurement framework using these steps.
### Step 1: Define the business objective
Example:
Generate qualified leads.
### Step 2: Define the conversion
Example:
A completed consultation form.
### Step 3: Identify supporting metrics
For example:
• Impressions
• Clicks
• CTR
• Landing-page visits
• Form completion rate
• Leads
• CPL
### Step 4: Add quality metrics
For example:
• Qualified leads
• Sales opportunities
• Customers
• Revenue
### Step 5: Assign conversion values where appropriate
If different conversions have different business values, capture that difference where your measurement setup supports it.
### Step 6: Build reporting
Bring the relevant data together in your analytics or reporting platform.
### Step 7: Review trends
Compare performance over appropriate time periods.
### Step 8: Take action
Use the data to decide:
• What should be scaled?
• What should be improved?
• What should be tested?
• What should be reduced?
• Where should budget move?
Measurement is valuable only when it leads to better decisions.
---
# 25. How to Analyze a Campaign Properly
When reviewing a campaign, avoid looking at a single metric.
Use a layered approach.
### Layer 1: Delivery
Check:
• Impressions
• Reach
• Frequency
• Spend
• Pacing
### Layer 2: Engagement
Check:
• Clicks
• CTR
• CPC
• Video engagement
### Layer 3: Conversion
Check:
• Conversions
• Conversion rate
• CPL
• CPA
### Layer 4: Business Value
Check:
• Revenue
• Conversion value
• ROAS
• CAC
• ROI
### Layer 5: Quality
Check:
• Qualified leads
• Sales opportunities
• Customer conversion rate
• Customer value
This approach helps you understand not only whether a campaign generated activity, but whether that activity created business value.
---
# 26. Common Marketing Measurement Mistakes
### Mistake 1: Tracking too many metrics
More metrics do not automatically mean better analysis.
Focus on the metrics connected to your objectives.
### Mistake 2: Optimizing for clicks only
Clicks can generate traffic without generating meaningful business outcomes.
### Mistake 3: Ignoring conversion tracking
Without reliable conversion measurement, it becomes difficult to understand which campaigns are actually producing results.
### Mistake 4: Measuring leads but ignoring quality
A large number of poor-quality leads can consume sales resources without generating revenue.
### Mistake 5: Comparing unrelated campaigns
A brand-awareness campaign and a direct-response campaign should not necessarily be judged by exactly the same KPIs.
### Mistake 6: Changing campaigns too frequently
Constant changes can make it difficult to understand which action caused a performance change.
### Mistake 7: Looking only at short-term results
Some marketing activities take time to influence customers.
Consider the buying cycle when interpreting results.
### Mistake 8: Ignoring business outcomes
Marketing metrics should eventually connect to meaningful business results whenever measurement allows.
---
# 27. Example: Measuring an E-Commerce Campaign
Imagine an online store spends:
₹200,000 on advertising.
The campaign generates:
1,000,000 impressions
20,000 clicks
1,000 purchases
₹600,000 revenue
Let's calculate some basic metrics.
### CTR
20,000 ÷ 1,000,000 × 100
= 2%
### CPC
₹200,000 ÷ 20,000
= ₹10
### Conversion Rate
1,000 ÷ 20,000 × 100
= 5%
### CPA
₹200,000 ÷ 1,000
= ₹200
### ROAS
₹600,000 ÷ ₹200,000
= 3
The campaign generated ₹3 in measured revenue for every ₹1 spent on advertising.
But the analysis should not stop there.
The business should also consider:
• Product cost
• Shipping
• Discounts
• Returns
• Payment fees
• Customer lifetime value
• Profit margin
This demonstrates why marketing measurement should connect advertising data with business data.
---
# 28. Example: Measuring a B2B Lead Generation Campaign
Imagine a B2B company spends:
₹100,000
The campaign generates:
500 leads
150 qualified leads
50 sales opportunities
10 customers
₹500,000 in revenue
Now we can calculate:
### Cost Per Lead
₹100,000 ÷ 500
= ₹200
### Cost Per Qualified Lead
₹100,000 ÷ 150
= approximately ₹667
### Cost Per Customer
₹100,000 ÷ 10
= ₹10,000
### Revenue Per Customer
₹500,000 ÷ 10
= ₹50,000
The first metric, CPL, looks attractive.
But the deeper analysis shows what happened after the lead was generated.
That is why measuring the full funnel is important.
---
# 29. Tools Used for Marketing Measurement
Different businesses use different combinations of tools.
Common categories include:
### Web Analytics
Used to understand website traffic, user behavior and conversions.
Example:
Google Analytics.
### Advertising Platforms
Used to measure campaign delivery, clicks, conversions and advertising costs.
Examples:
Google Ads
Meta Ads
DV360
LinkedIn Ads
### Tag Management
Used to manage measurement tags and tracking implementations.
Example:
Google Tag Manager.
### CRM Platforms
Used to manage leads, opportunities, customers and sales outcomes.
Examples include:
Salesforce
HubSpot
Microsoft Dynamics
### Reporting and Visualization
Used to combine and visualize data.
Examples include:
Looker Studio
Power BI
Tableau
The important point is not to collect data from every available platform.
Choose tools that support your measurement requirements.
---
# 30. Connecting Marketing Data With Business Data
Marketing platforms can tell you what happened to campaigns.
A CRM can tell you what happened to leads.
For example:
Ad → Click → Website → Form → Lead → Qualified Lead → Opportunity → Customer
If these systems are disconnected, marketers may only see the first part of the journey.
When systems are connected appropriately, organizations can better understand how marketing activity contributes to downstream outcomes.
This is particularly valuable for businesses where the sales process continues after the initial lead submission.
---
# 31. How Often Should You Measure Marketing Performance?
There is no single frequency that works for every campaign.
### Daily
Useful for monitoring:
• Spend
• Delivery
• Pacing
• Major tracking problems
• Significant performance changes
### Weekly
Useful for:
• Campaign optimization
• Creative performance
• Audience performance
• Budget allocation
• Conversion trends
### Monthly
Useful for:
• Channel comparisons
• ROI
• Customer acquisition
• Revenue
• Strategic decisions
### Quarterly
Useful for:
• Overall marketing strategy
• Budget planning
• Channel effectiveness
• Long-term trends
• Business growth
The frequency should match the campaign's scale, objective and buying cycle.
---
# 32. A Simple Marketing Performance Scorecard
A practical scorecard could look like this:
Objective:
Generate qualified leads
Primary KPIs:
• Qualified leads
• Cost per qualified lead
• Customer acquisition cost
Supporting metrics:
• Impressions
• CTR
• CPC
• Landing-page conversion rate
• Total leads
Business outcomes:
• Opportunities
• Customers
• Revenue
• ROI
This structure prevents teams from getting distracted by numbers that do not influence decisions.
---
# 33. The Most Important Question to Ask
When reviewing marketing performance, don't ask only:
"Did the campaign perform well?"
Ask:
"Did the campaign achieve its intended business objective, and what does the data tell us to do next?"
That question changes the way marketing measurement is approached.
A campaign can have excellent CTR but poor sales.
A campaign can have expensive clicks but highly valuable customers.
A campaign can generate fewer leads but significantly more revenue.
The correct interpretation depends on the objective and the complete customer journey.
---
# Conclusion
Measuring marketing performance is not about collecting as many numbers as possible.
It is about connecting marketing activity to meaningful outcomes.
Start with the business objective.
Then define the conversion.
Choose the KPIs that represent success.
Track supporting metrics.
Measure conversion quality.
Understand attribution.
Connect marketing activity with business outcomes where possible.
Finally, use the data to make decisions.
A strong marketing measurement framework can help answer three fundamental questions:
1. What happened?
2. Why did it happen?
3. What should we do next?
When marketers can answer all three, analytics becomes more than reporting.
It becomes a decision-making tool.
That is the real purpose of measuring marketing performance.